
 English (UK)
  Русский (RU)
  Arabic (اللغة العربية)


Rules for effective trading: technical analysis
Trading success depends on the correct use of the chart. It's required to know certain basic principles and instruments. Technical analysis is one of the instrument suitable for this work, it allows to plot a trade chart as accurately as possible.
Trade technical analysis is an efficient way to forecast a price behaviour considering the history of previous price movements at the market. While studying price behaviour history you may find some frequent regularities. If you study and memorize it, you can forecast the price movement in future.
As you already guessed right the price movement chart as a quotations history - is the main object of technical analysis. Actually the methods of the chart plotting is the axis using where the price is rendered vertically and the time - horizontally. There are several types of these charts. The main difference between the instruments is in a method of plotting and in the time intervals. First of all we propose to review the differences of the charts in accordance with a method of plotting.
The chart is one of the key instruments for successful trading.
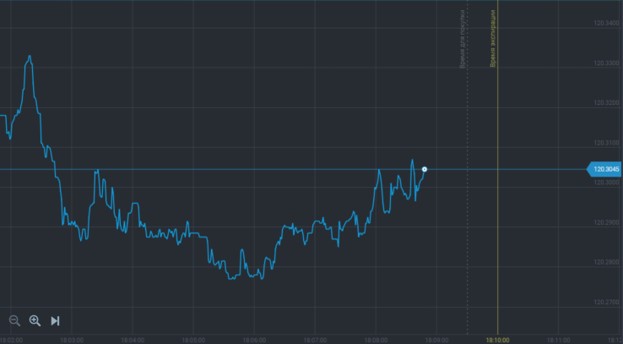
The standard line chart is the easiest variation of such instrument. It’s a chart with a price behaviours fixed by the points connected with lines.
The points are fixed only after a certain time interval termination. It should be noted that every further point indicated in chart is connected with a previous one by lines. The chart commonly is as follows:
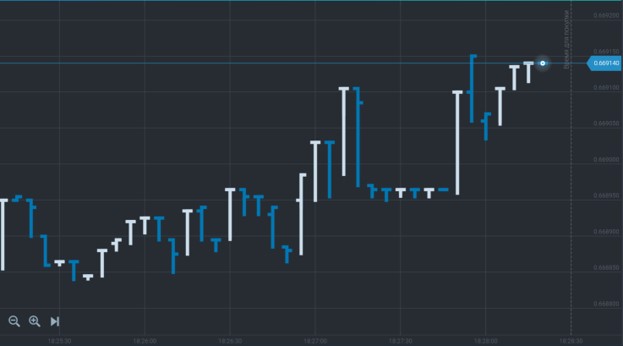
Other commonly used chart type is the instrument plotted by applying the bars. As you can see from the title, it consists of the bars. The last one shows us a price at the beginning of time interval, other words - the opening price. Also, the bars show maximum and minimum price for this time period, the price in the end of time interval moment (closing price). Below you may find the example of the chart:
Candlestick chart
It is closing three the most popular charts. This instrument type has particularities are akin to the bars. It’s providing the same information as a bar chart. But there is a substantial advantage, the candlestick chart is visually much better perceived. This is due to the special structure, so-called candlesticks are built from rectangles.
Where a bearish candlestick shows a reduction of price and a bullish candle shows a price increase.
Let's summarize briefly
Finalizing the above information there are 3 types of the chart. A candlesticks, a bar and a line charts. Also the charts are divided by the time intervals. 1 minute, 5 minutes, 15 minutes, 30 minutes, 1 hour, 4 hours, a day, a week and a month.
Time interval is a time period for which the price is fixed in the chart. For example, if the time interval is 1 hour, then we’ll see a bar or a candlestick in the chart that will show us a price at the beginning of the hour, its maximum and minimum value within this hour and a price at the end of the hour.
You can analyze the price movements while using a switch of time periods in a certain interval. How to do it? You need to use technical analysis for this.
Trade technical analysis axioms
You need to know some guidelines to make a high-quality technical analysis. They are represented in the following aspects:
- Axiom #1: Price performance is always moving directionally.
Axiom #1: Price performance is always moving directionally. The above mentioned rule is a key factor in the trends estimating. Also, the first axiom is including the following actions: Most probably the current trend of prices at the market will be continued rather than will be stopped, and the price movement in one direction will be continued until getting weaker.
- It’s possible repeating of price position;
This aspect concerns price movement charts, making it more unpredictable through the possibility of price to become initial in a certain time interval. Studying the behavior history of these price movement models gives us a possibility to forecast the following direction of movement with a great probability.
- The price includes absolutely all the aspects.
Value formation is formed under the influence of absolutely all factors submitted by political, natural and economic aspects. Therefore the pricing is a combined action which includes all the above-mentioned factors.
The technical analysis is significantly simplifying and becoming more precise with using the above rules. The technical analysis axioms allow to evaluate market efficiently and to forecast the future trends with a high probability whereby it will be formed the effective currency price.
According to this it needs to understand that with a minimum skills existence it’s necessary to use visual models of a value fluctuation to minimize exposure to loss. It should be noted that the technical analysis will not give 100% warranty as a financial market is extra unstable.


